Deletion Rates by TLD: Where Domains Die Fastest (Data)
Domain deletion is the industry's largest and least-examined flow. Headlines follow registration growth and record sales, but every day a six-figure crowd of domains quietly stops existing, and where those deaths concentrate says more about the market than any launch announcement. This piece assembles what the public data actually supports about deletion rates by TLD, what the daily numbers mean, which segments churn fastest, and where the data honestly runs out.
How many domains die per day?
The honest answer is a range, because "die" has more than one definition. Published pending-delete lists run around 100,000 names on a typical day: these are gTLD names formally in the deletion pipeline with a knowable drop date. Broader counts of names dropped or deleted across all extensions, including ccTLDs with no pendingDelete stage and names removed without ever being listed, run to 200,000 or more per day. Neither figure is wrong; they count different funnels. Whichever end you prefer, the arithmetic is striking: even the conservative end implies tens of millions of deletions a year, against a total base of 386.9 million registered domains reported in Verisign's Q4 2025 Domain Name Industry Brief. The pendingDelete explainer covers how the listed portion of that flow becomes visible five days before it happens.
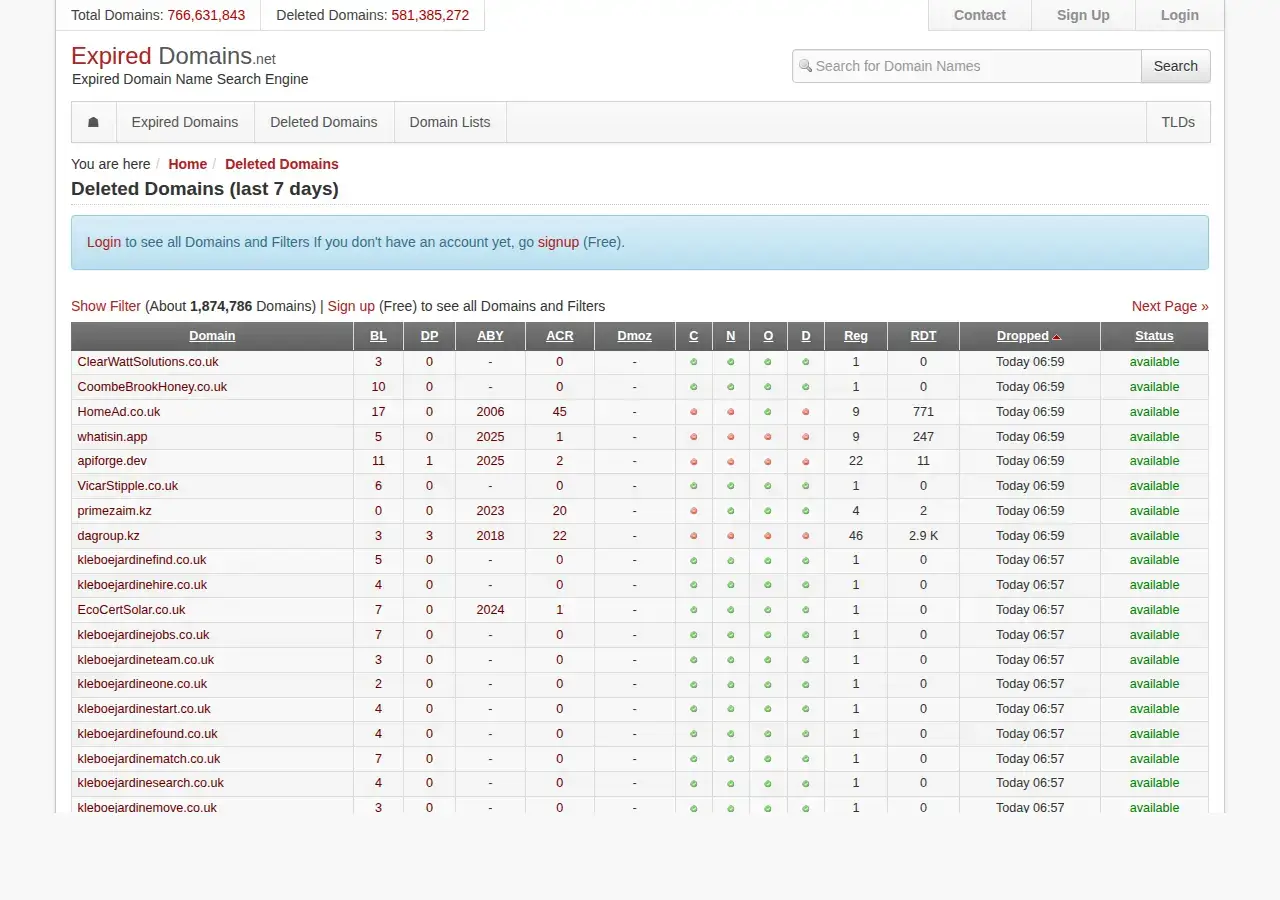
ExpiredDomains.net's deleted-domains list, counting 1.87 million names across the last 7 days, captured August 2026
The market baseline, segment by segment
Deletion rates only make sense against the stock they drain. As of the Q4 2025 DNIB:
| Segment | Registered base (Q4 2025) | Reported trend | Churn character |
|---|---|---|---|
| All TLDs | 386.9 million | +6.2% year over year | Net growth despite a daily deletion flow in six figures; gross adds far exceed net adds |
| .com | 161.0 million | Largest single TLD | The stable core: mature stock, established sites, the strongest aftermarket safety net under lapsing names |
| ccTLDs | 145.6 million | Aftermarket sales volume up 61% in 2025 (NameBio) | Policy-driven: deletion speed set per registry, from .de near-instant deletes to .uk's 90-day suspension |
| New gTLDs | 47.8 million | +29.9% year over year | Fastest inflow and, by industry consensus, the fastest outflow: promo-priced registrations meet full-price renewals |
Why new gTLDs churn fastest
The mechanism is pricing, not fashion. New gTLD registries compete for volume with deep first-year discounts, which fills the zone with speculative and disposable registrations whose renewal decision arrives at a much higher full price. A name registered for pennies as an experiment faces a renewal invoice that asks a real question, and huge numbers answer no. That is why the segment can grow 29.9% year over year and still be the churn capital of the industry: the front door and the back door are both wide open, and gross registrations run far ahead of the net figure that survives into the DNIB totals. For drop hunters this cuts both ways: enormous daily lists, but a low hit rate of names anyone should want.
Why .com stays stable
.com deletion is a smaller share of a bigger, older base. The 161.0 million .com stock skews toward long-held names: businesses with websites, portfolios under management, brands defending trademarks, none of which lapse casually. When .com names do reach the end, an aftermarket conveyor of expiry auctions and closeouts is waiting to intercept anything with measurable value before deletion, at GoDaddy alone 35,000+ newly expiring domains list daily. The names that actually complete deletion in .com are disproportionately the leftovers, though the sheer size of the base still makes the .com section of any day's drop list the one with the most accumulated history in it, which is why serious hunters read it daily anyway. The aftermarket reinforces the stability from the other side: NameBio recorded roughly 190,300 sales worth over $244 million in 2025, up 31.9% year over year, and resale value is a renewal argument every time an invoice arrives.
Where policy, not economics, sets the death rate
Across ccTLDs, deletion speed is a registry decision before it is a market outcome. DENIC can delete a .de near-instantly with no standard redemption; Nominet holds expired .uk names in suspension for roughly 90 days; SIDN quarantines .nl before release; and Anguilla's .ai deletes almost nothing, routing expired names into official auctions instead, with unsold inventory kept in the registry's DropZone. Two extensions with identical commercial demand can therefore show completely different deletion profiles purely because of lifecycle design; the per-registry details are collected in the ccTLD deletion quirks guide. Registry-side monetization is the trend to watch, because every TLD that adopts auction-first expiry, as .ai has, converts deletions into transfers and shrinks the public drop.
What the data cannot tell you
Honest limits, stated plainly. No central body publishes a per-TLD deletion league table; the DNIB reports stocks and growth, not churn, so per-TLD deletion rates must be inferred from drop lists and registry files that count differently. ccTLD deletions are patchily visible because many registries publish no equivalent of the gTLD pendingDelete stage. And daily figures swing with registry batch behavior, so any single day is a poor sample. Treat every precise-sounding deletion rate you encounter, here included, as an estimate with a definition attached, and check what was actually counted before comparing two numbers.
Using the churn map as a hunter
The practical translation: fish where deaths are frequent and value is real. High-churn new gTLD lists are haystacks with few needles; the .com drop is smaller relative to its base but rich in aged, linked names; ccTLD flows reward specialists who learn one registry's rhythm. Filtering is the whole job, given that the raw flow into each day's releases runs to six figures. ExpiredDomains.net publishes the lists free across 676 TLDs, and DomCop (paid, annual plans from roughly $68 per month, no free trial, 2-day money-back guarantee) ranks the same flow by authority, backlink and spam metrics so the day's 100,000 deaths shrink to a reviewable shortlist.
Frequently asked questions
How many domains are deleted every day?
Estimates run from around 100,000 names on published pending-delete lists to 200,000 or more actually dropped or deleted across all TLDs. The spread comes from definitions: listed gTLD deletions are only part of the total flow.
Which TLD has the highest deletion rate?
No registry publishes an official league table, but industry consensus puts new gTLDs at the top proportionally, driven by promo-priced first-year registrations that lapse at full-price renewal. .com deletes heavily in absolute terms simply because its base is 161.0 million names.
Do more domains die than get registered?
No. Total registrations grew 6.2% year over year to 386.9 million in Verisign's Q4 2025 brief, so registrations outpace deletions overall, though individual TLDs can shrink while the market grows.
Are ccTLD deletions included in daily drop numbers?
Often only partially. Many ccTLD registries have no public pendingDelete stage, so their deletions surface through registry-specific channels rather than the standard lists, which is one reason broader estimates exceed the listed 100,000.
Does the .ai boom show up in deletion data?
Mostly as an absence. .ai grew from about 40,000 registrations in 2020 to roughly 859,000 by August 2025, with around 2,008 new names per day in January 2026, yet its expired names route to auctions rather than deletion lists, so the boom barely registers in drop data.